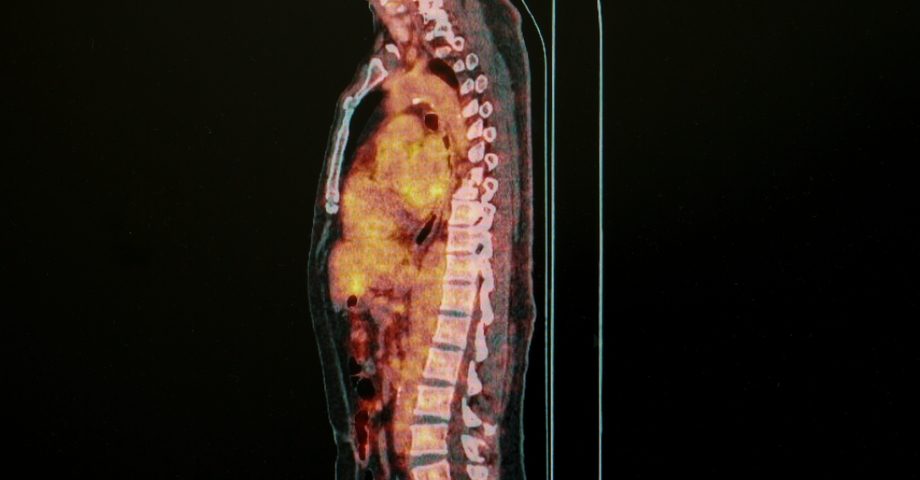
The cross-sectional area (CSA) of the spinal cord in males with adrenoleukodystrophy (ALD) is smaller and flatter, and correlates with the severity of spinal cord degeneration (myelopathy) in those with symptoms, a study reported.
The findings suggest spinal cord CSA as a reliable marker for the severity of ALD-associated myelopathy, and that it can be used as an outcome measure in clinical trials, the scientists said.
The study, “Spinal cord atrophy as a measure of severity of myelopathy in adrenoleukodystrophy,” was published in the Journal of Inherited Metabolic Disease.
Most adults with ALD develop myelopathy, a condition characterized by the degeneration of nerves running from the brain through the spinal cord.
However, the rate of myelopathy progression and the age of onset in ALD patients can vary. Yet current clinical measures of myelopathy severity are not sensitive enough to small changes in disease.
More sensitive ways of testing the efficacy of potential therapies in ALD research are needed.
Studies investigating various neurodegenerative disorders often use magnetic resonance imaging (MRI) to measure spinal cord atrophy (degeneration). For example, people with multiple sclerosis (MS) and amyotrophic lateral sclerosis (ALS) have a significantly smaller spinal cord CSA compared to people without these disease.
Although spinal cord degeneration is the pathological hallmark of ALD, studies measuring atrophy in patients are limited, and do not correlate it with disability or disease duration.
In an effort to better quantify the degree of spinal cord atrophy in ALD, researchers at Amsterdam University Medical Centers, in collaboration with investigators at the University of Minnesota, used a variety of spinal cord MRI metrics to measure CSA in ALD patients, and to match their findings with conventional clinical outcomes.
The team recruited 74 males (older than age 16) with baseline MRI images available, including 42 ALD patients (mean age of 45.9) and 32 age-matched healthy people serving as controls.
The degree of myelopathy severity was measured using the Expanded Disability Status Scale (EDSS); the Severity Scoring system for Progressive Myelopathy (SSPROM); the Timed Up-and-Go test, which assesses the time it takes to get up from an armchair, and walk 6 meters, turning once; and the 6-Minute Walk Test (6MWT), which measures how far a person can walk in six minutes.
Separating patients into two groups based on the presence of myelopathy symptoms revealed that differences in spinal cord CSA were specific to those with symptoms. There was no difference in spinal CSA between asymptomatic patients and healthy controls.
Spinal cord CSA significantly correlated with clinical measures of myelopathy severity, specifically EDSS, SSPROM, disease duration, and vibration sense scores — an additional measure of sensation using a tuning fork applied to the foot and ankle.
Follow-up MRI images were available for 26 of the 42 patients, with a median time between scans taken at the study’s start (baseline) and those in follow-up of 11 months. While there was no significant overall change in spinal cord CSA on follow-up, among those with symptoms a trend in reduction in the mid-neck area (C2 level) was found, which, on closer inspection, was significantly flatter.
No association found between baseline CSA and disease progression, as measured by a change in EDSS and vibration sense score.
“Our findings showed that the spinal cord is smaller and flatter in ALD patients with symptomatic myelopathy compared to controls,” the researchers wrote. “The degree of thinning correlated with clinical outcome measures for myelopathy.”
Based on the results, the team suggested that “CSA is a reliable marker of disease severity, and can be a valuable outcome measure in long‐term follow‐up studies in ALD.”


